🌍 World Map
📘 Overview
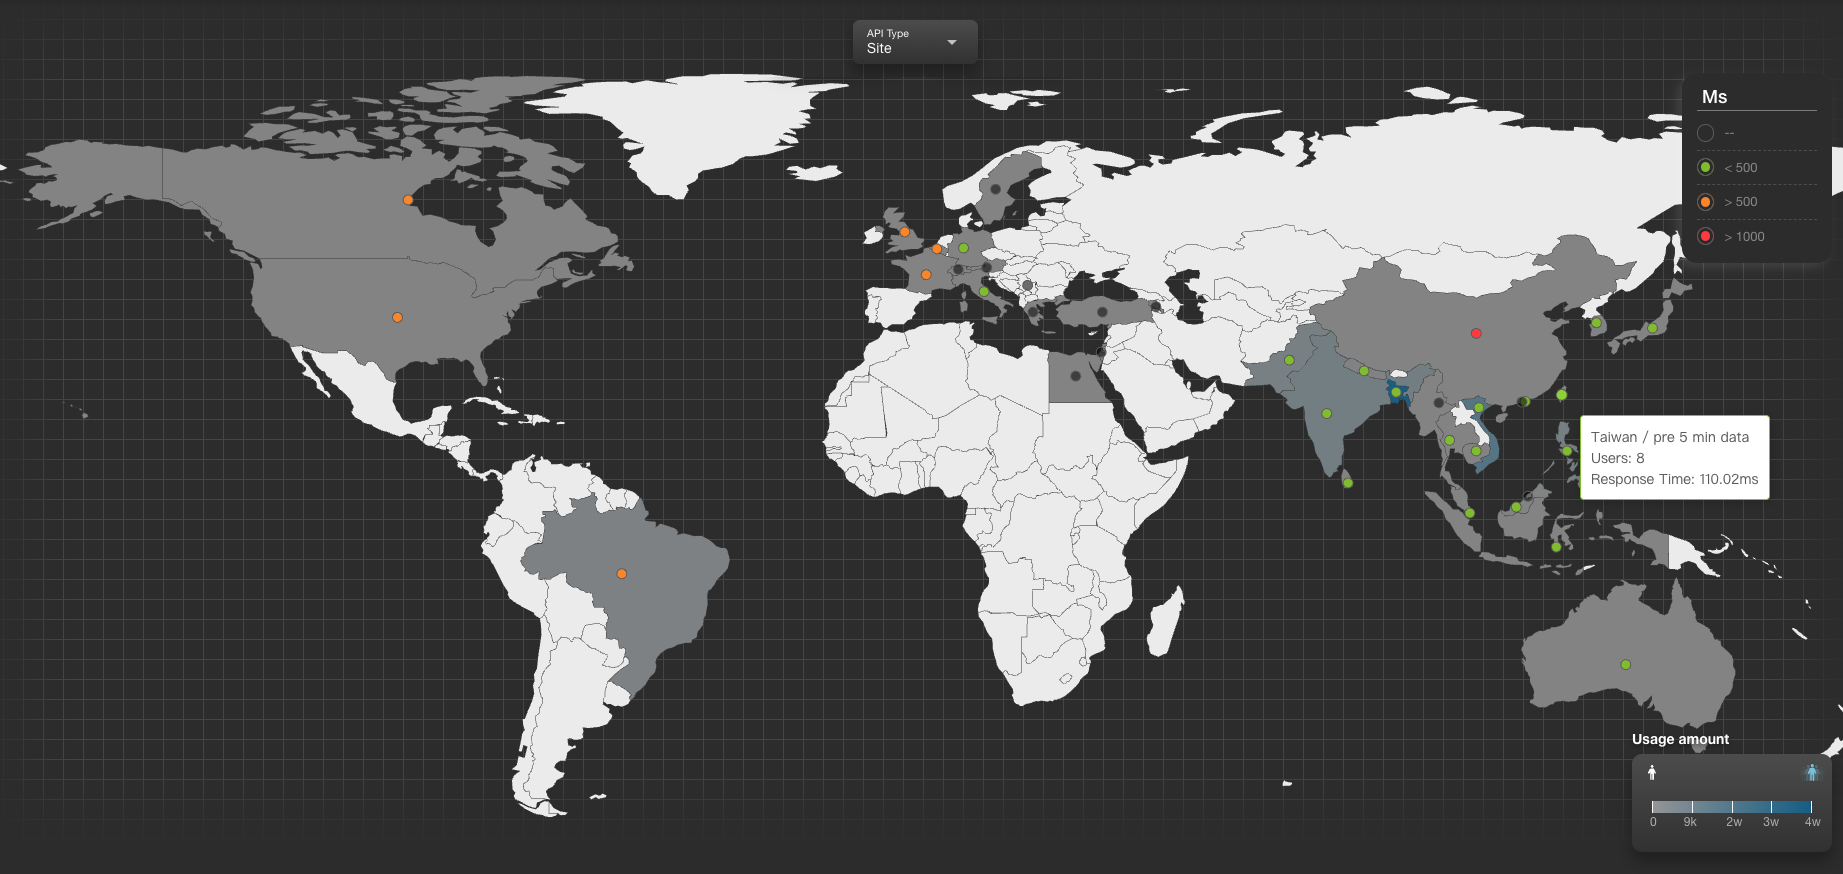
This page presents a global interactive map for monitoring service performance.
It provides users with a visual overview of website traffic, API response efficiency, and ISP status across different countries.
Clicking on any country opens a detailed panel showing website and ISP metrics for that region.
🧭 How to Use
Interactive Map
- Click on any country to view its detailed status panel.
- The color of each dot on the map represents the average response time of the website.
- The color shading of regions represents user volume in that area.
Detail Panel Explanation (Example: Taiwan)
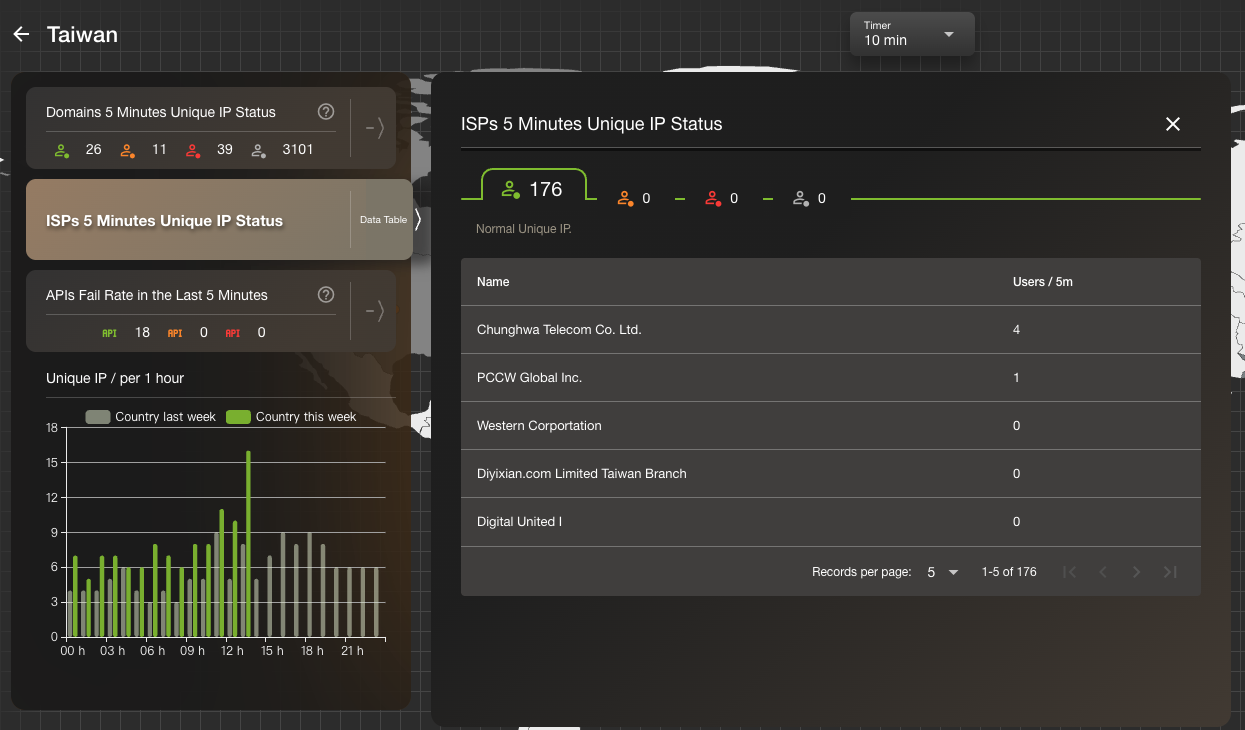
1. Domains – 5-Minute Unique Users
- Displays the number of unique IPs detected in the past 5 minutes.
- Lists the detected domains and their user counts.
- Each domain is assigned a status using color indicators:
- 🟢 Green: Normal
- 🟡 Yellow: Warning
- 🔴 Red: Error
- ⚪ Gray: No data
2. ISPs – 5-Minute Unique Users
- Shows unique IPs detected per ISP within the selected country.
- Each ISP is also marked with a four-color indicator to represent service health.
3. APIs – Fail Rate in the Last 5 Minutes
- Displays the success/failure ratio for APIs during the last 5 minutes.
- API status indicators:
- 🟢 Green: Error rate below 30% – Normal
- 🟡 Yellow: Error rate between 30–60% – Attention required
- 🔴 Red: Error rate 60% or higher – Potential issue
🔄 Status Panel (with Switchable Charts)

| Metric | Description |
|---|---|
| Users | Shows the current unique IP count. Click to view a time-based trend chart. |
| Query Failure Rate | Displays the failure rate for both site and 3r domains. Historical trends available on click. |
| Total Queries | Total number of queries for both site and 3r domains. Helps determine traffic volume. |
| Response Time | Shows the average response time (ms) for API calls. Useful for identifying latency issues. |
Site: Refers to internal domains within your website.3R: Refers to external domains (typically third-party APIs).