WebSite - API Info
📘 Overview
The API Info page allows you to perform in-depth troubleshooting when a domain shows a high error rate.
This view focuses on analyzing each API or static resource under a specific domain, including failure frequency, response time, and payload size.
It enables developers to quickly identify the root cause of abnormal behavior.
Supports:
- Error type breakdown (by HTTP code)
- Exception logging (e.g. 5xx errors)
Helping teams detect and resolve API issues efficiently.
🧭 Feature Breakdown
1. Filter Section
- Country and Domain dropdowns:
- Select a specific country and domain to narrow the analysis scope.
- Helpful for identifying whether errors are concentrated in a particular region or domain.
2. Status Overview (Top Right Info Panel)
- Total Success Request: Number of successful requests
- Total Fail Request: Number of failed requests
- AVG Response Time: Average response time (in ms)
- AVG Failure Rate: Average failure rate (as a percentage)
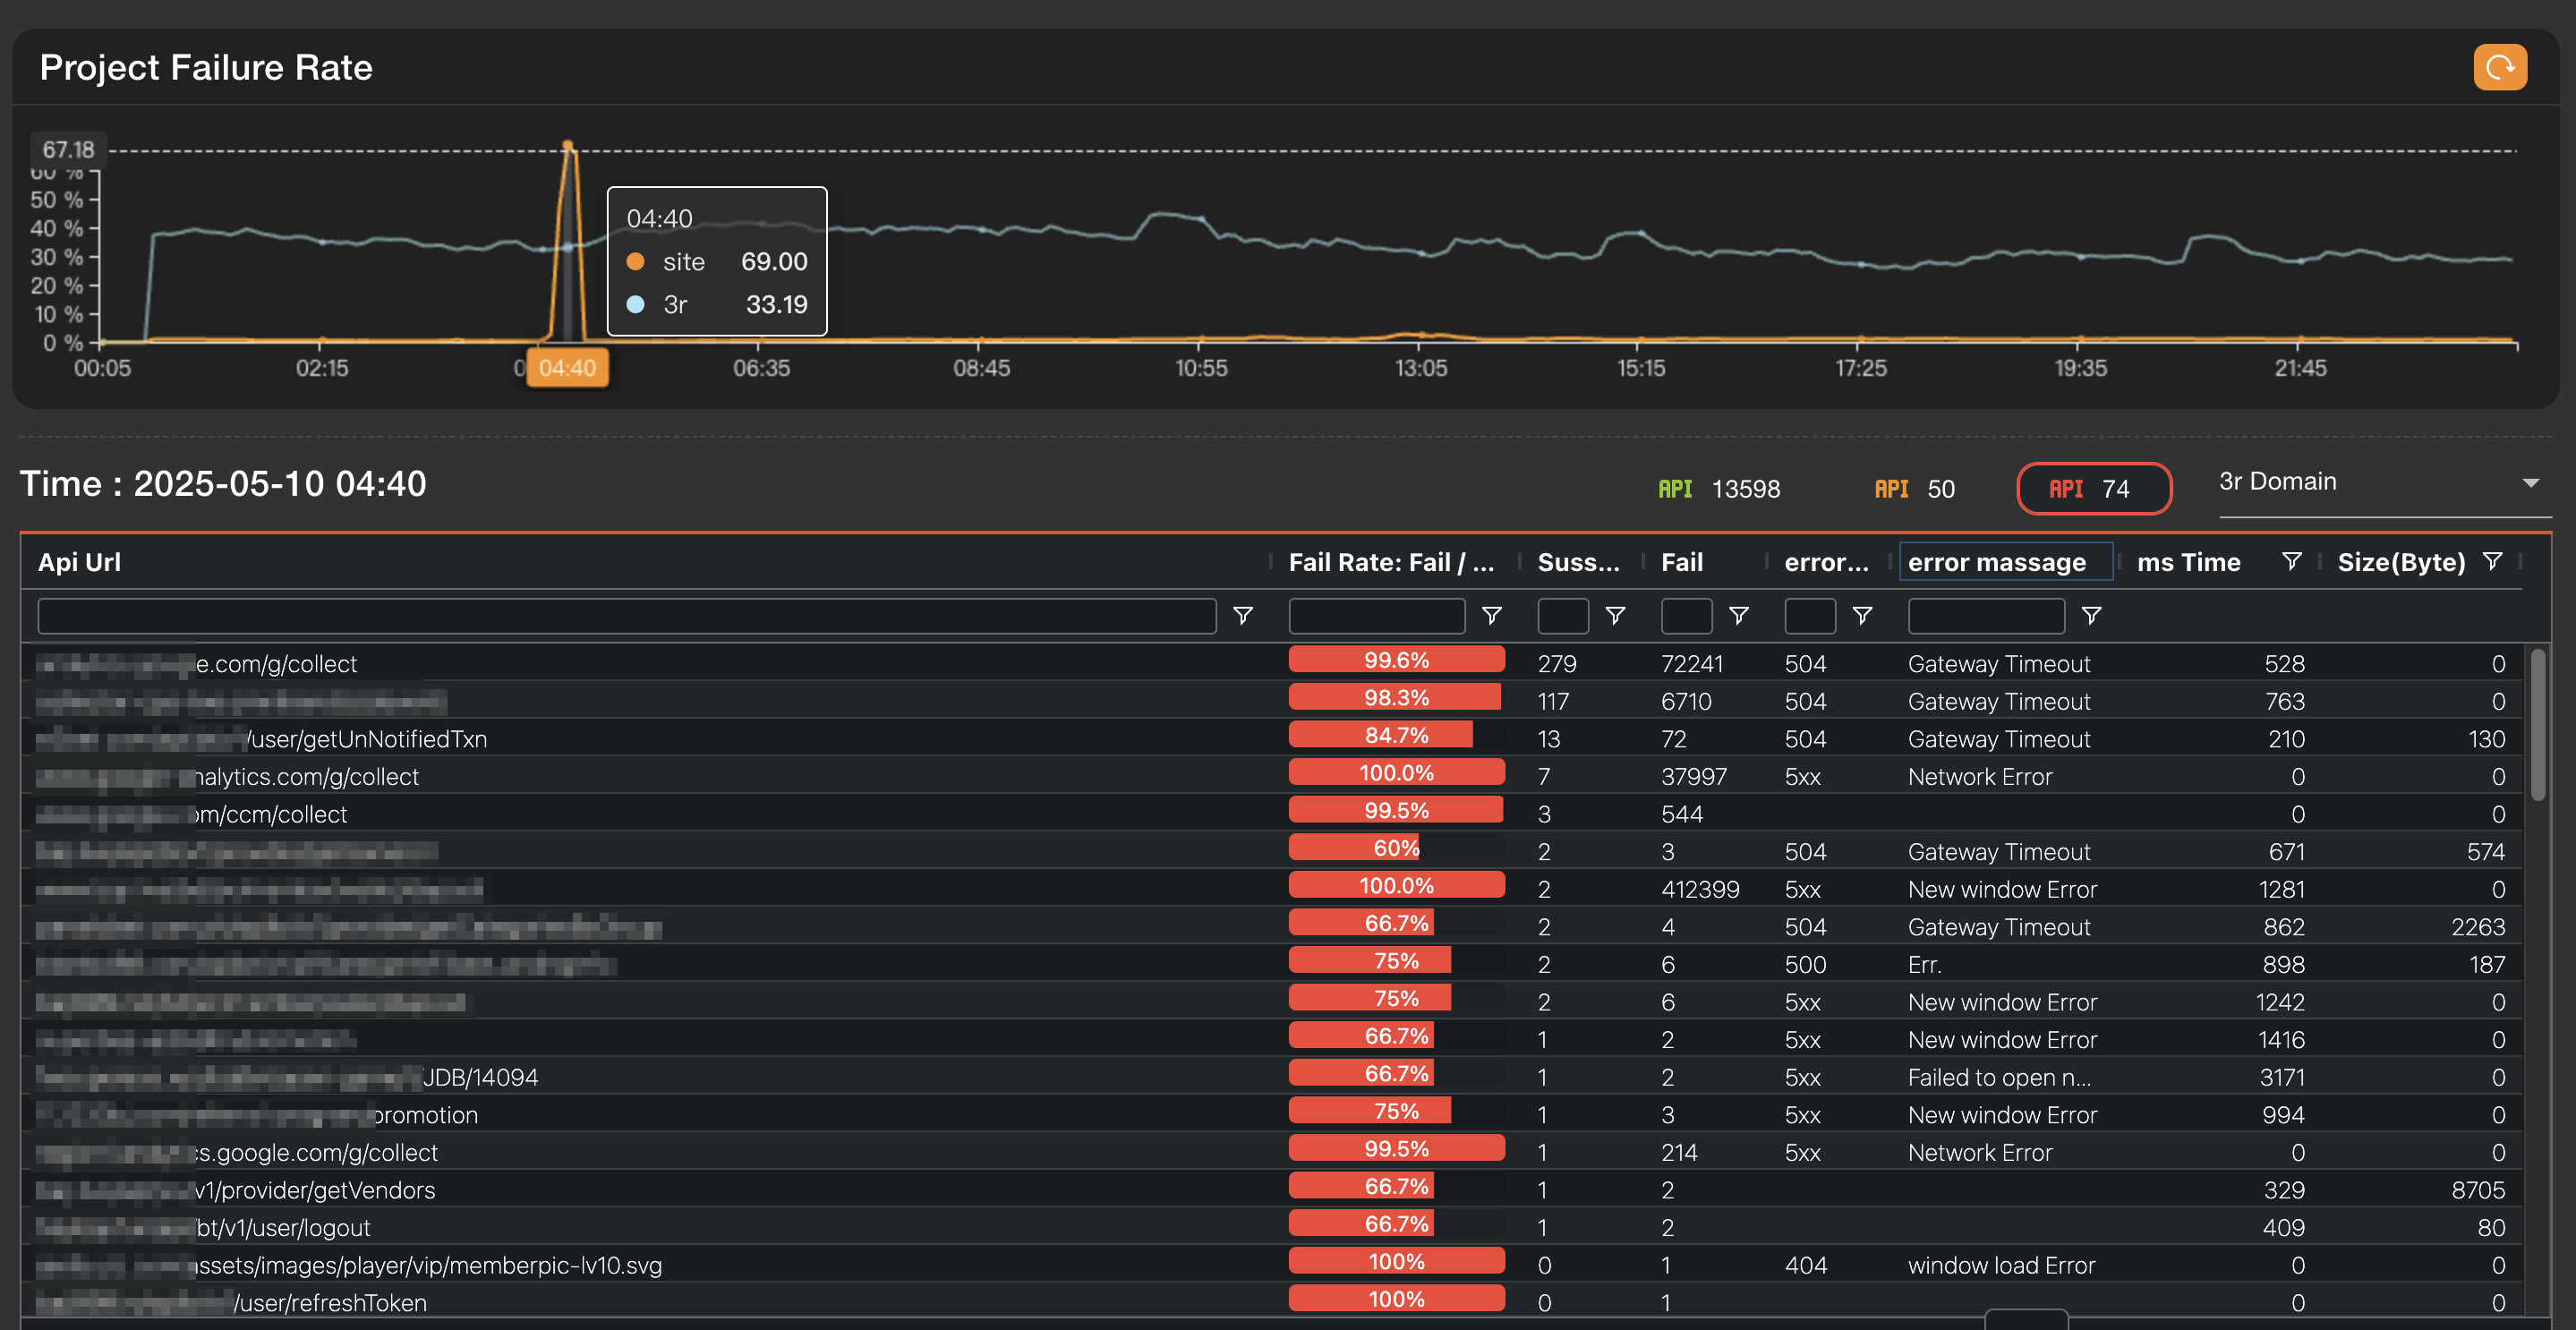
3. Project Failure Rate Trend
- Shows failure rate fluctuations over time for the selected domain.
- Click on any point in the graph to view corresponding API-level data in the table below.
- Useful for isolating time periods with abnormal error spikes.
📊 API Usage Data Table
After selecting a time point, the table will list all API requests during that period with the following columns:
| Column Name | Description |
|---|---|
| API URL | The endpoint or static resource being requested |
| Fail Rate | Failure rate (Fail / (Fail + Success)) |
| Success | Number of successful requests |
| Fail | Number of failed requests |
| Error Code | HTTP error status code (e.g., 5xx) |
| Error Message | The corresponding error message (e.g., Network Error) |
| ms Time | Average response time in milliseconds |
| Size (Byte) | Average payload size in bytes |
🔍 Usage Scenarios
Issue Detection
- If a domain shows a consistently high error rate, use this page to narrow down by country/domain to see if the issue is regional.
Time-Specific Analysis
- Use the trend chart to select spikes in error rate and identify problematic APIs during that time.
Error Diagnosis
- Use Error Code and Error Message to quickly understand the issue (e.g., timeout, 404, or network issues).
- You can also click on the API URL to open a test dialog and run diagnostics from the selected host.
- Performance Evaluation
- If response times are high or file sizes are large, it may lead to poor user experience.
- This page helps determine whether performance bottlenecks stem from inefficient API design or heavy static assets.
💡 When to Use
- Debugging periods with high API failure rates
- Evaluating the impact of large static resources on performance
- Comparing performance across multiple APIs
- Troubleshooting region-specific API availability issues (e.g., slower responses from certain countries)