WebSite - IP Detail
📘 Overview
This page allows you to analyze the activity footprint and request behavior of a specific user IP.
It helps identify traffic volume, error rate, and response time across different time ranges, domains, and APIs.
- Query detailed request records for a specified IP
- View all domains and API endpoints accessed by the IP
- Analyze average request rate, response time, and failure rate
- Display the IP's location information including country, city, ISP, and regional latency
- Visualize API request volume and response time trends for anomaly diagnostics
🧭 Interface Overview
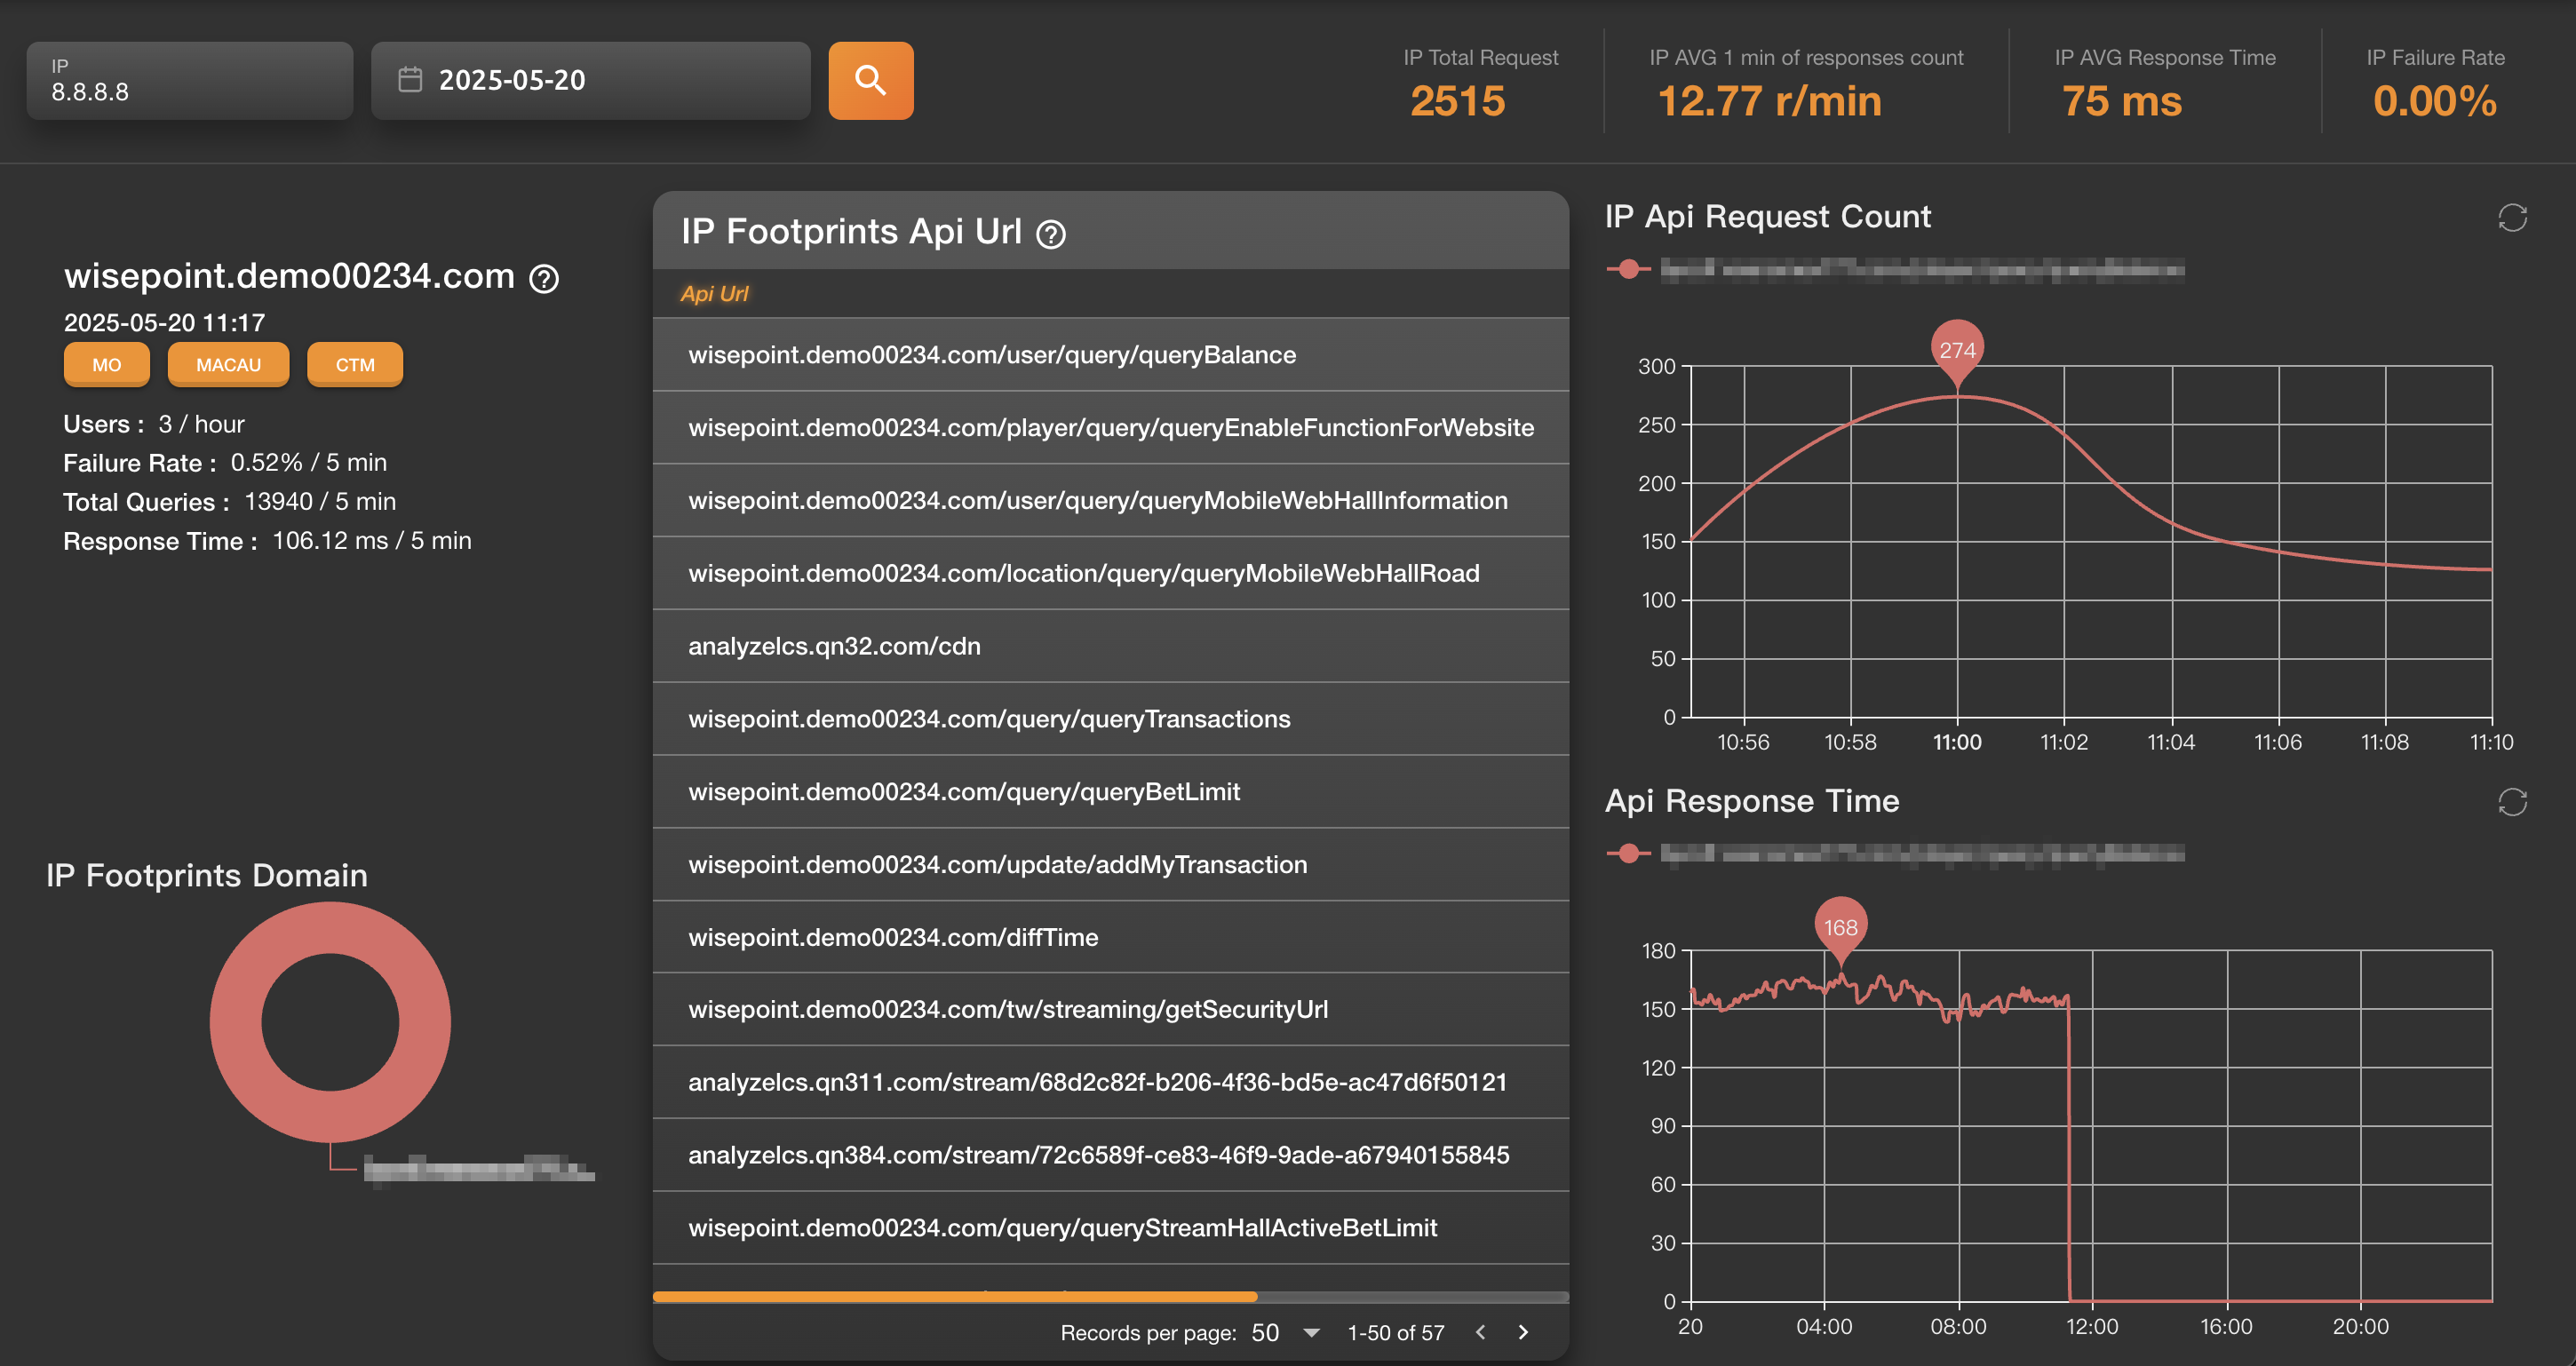
Left Panel
- IP Info Panel: Shows query time, country/city/ISP, total requests, average response time, failure rate, etc.
- IP Footprints (Domain): A pie chart showing the distribution of domains accessed by the IP
Center Panel
- IP Footprints (API URL List): Displays all API paths the IP has requested
- Columns include: API URL, request count, failure count, average latency (ms)
Right Panel
- IP API Request Count (Line Chart): Visualizes the volume of API requests made over time
- API Response Time (Line Chart): Shows trends in average response time to help spot latency spikes or anomalies
📈 When to Use
- Analyze a single IP's usage footprint and performance quality
- Identify if high latency or error rates are concentrated in a specific IP or region
- For security diagnostics: investigate abnormal behavior by pinpointing the exact API and time range involved
📍 Chart Interpretation
- Line charts include markers for peak request count or response time
- A progress bar below the API list indicates how many entries are currently displayed
- If request counts stay at zero for an extended period, the IP may have disconnected or the connection has failed