Project Info
📘 Overview
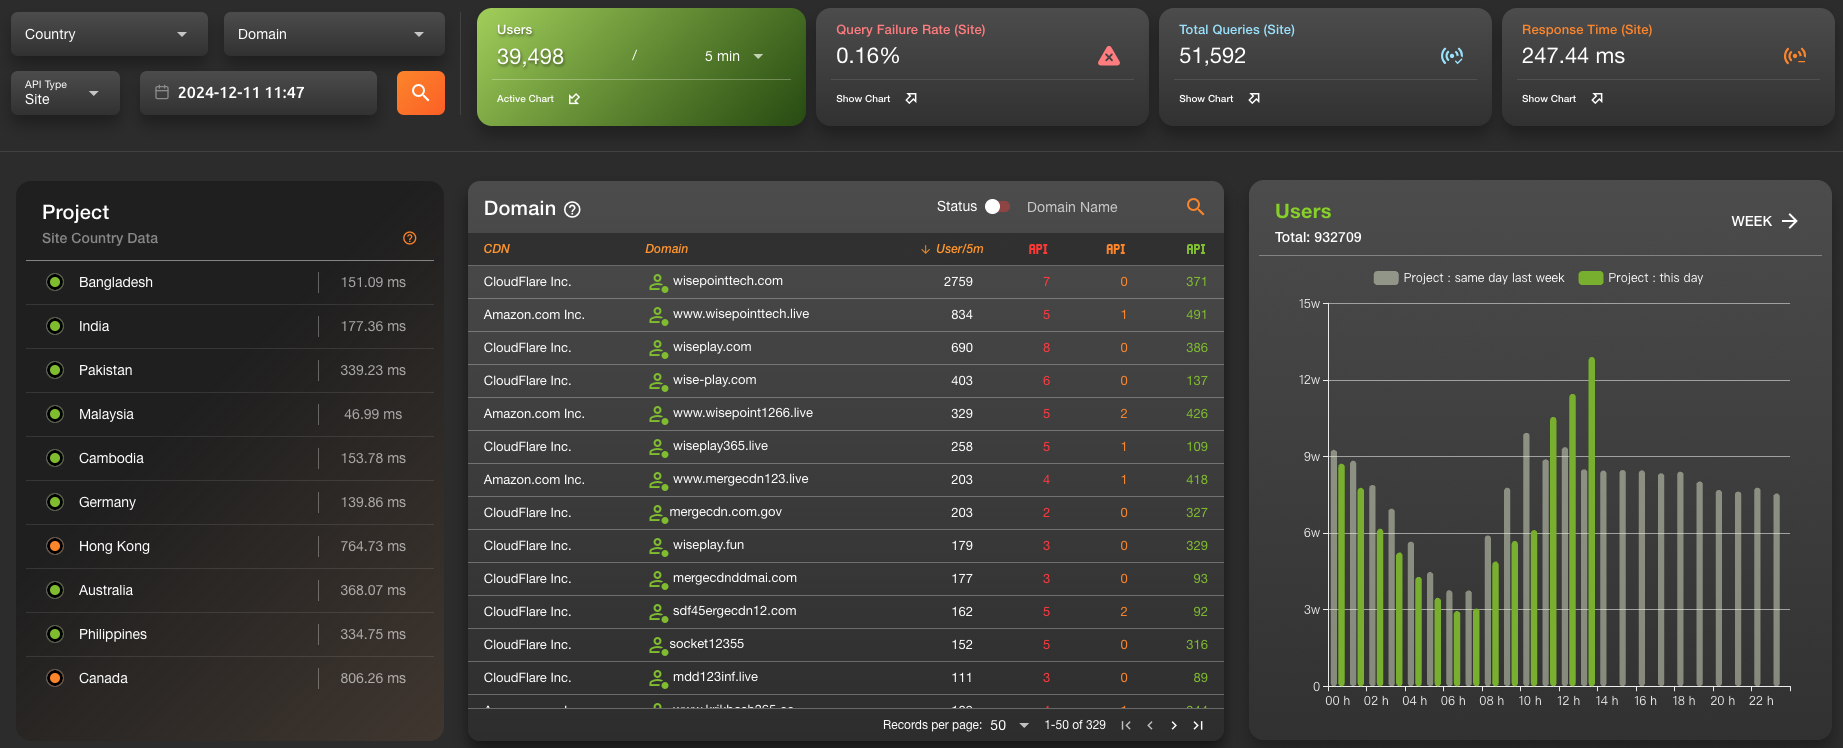
The Project Info page provides an overview of all domains within the project.
Domains are categorized into two types:
- Site: Domains internal to your website.
- 3R: External domains, often referring to third-party APIs.
This page includes detailed domain statistics, real-time metrics, and trend visualizations.
🧭 Main Sections & Description
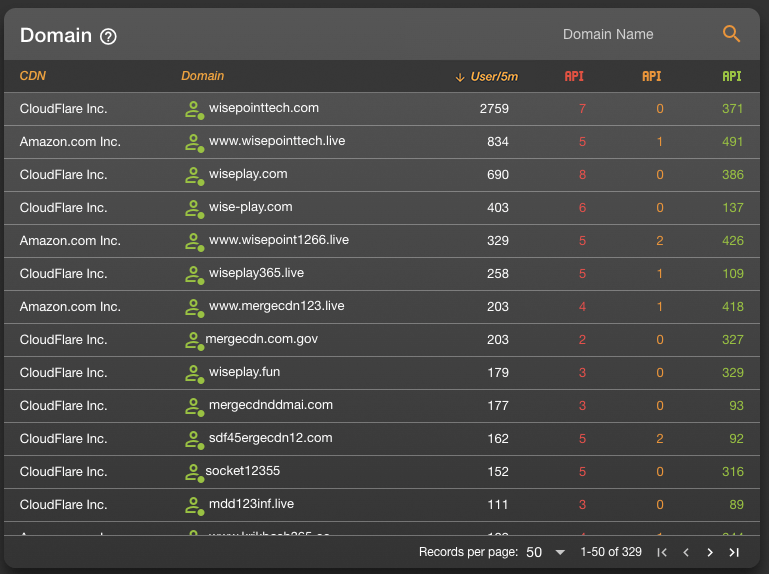
1. Search Bar
- Located at the top of the page, allowing users to filter domains using keywords.
- Supports fuzzy search, and results are reflected instantly in the domain table.
2. Four Key Status Metrics
Displayed to the right of the search bar:
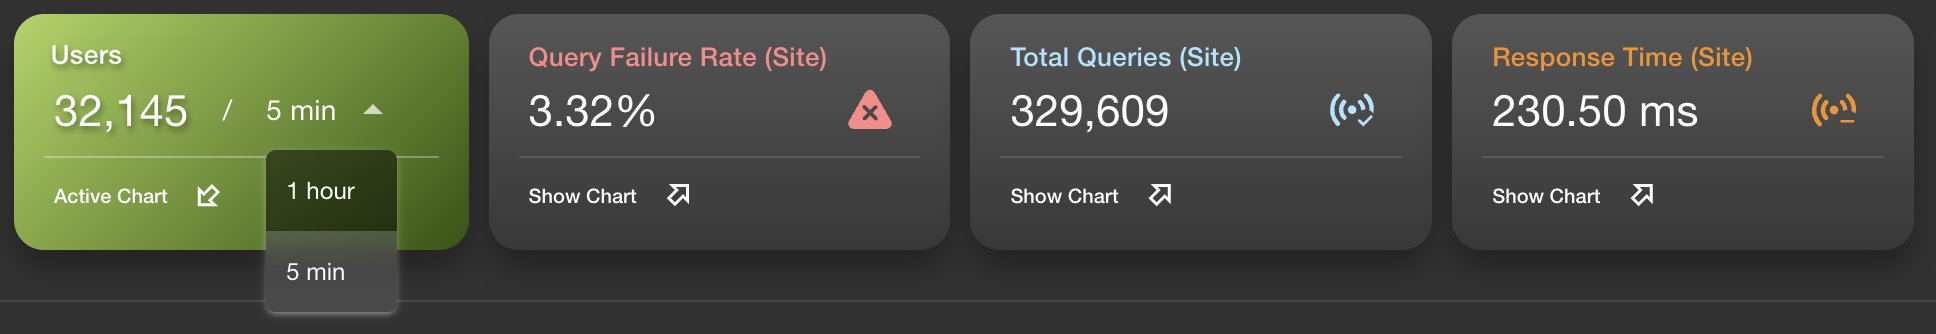
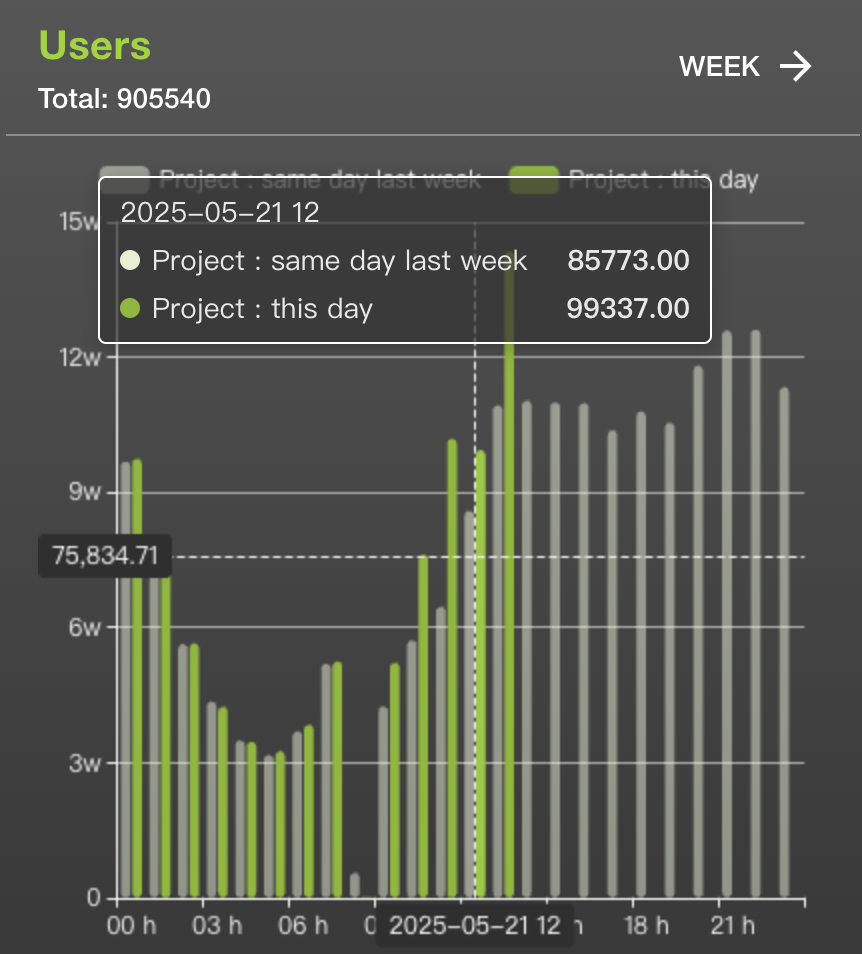
Users (every 5 min or hourly)
- Shows the number of unique IPs interacting with the domain in the last 5 minutes or 1 hour.
- The trend chart offers Hour, Day, and Week views for switching between timeframes.
Failure Rate (every 5 min)
- Displays the request failure rate of the domain over the last 5 minutes.
- Includes a trend chart to visualize error fluctuations.
Total Queries (every 5 min)
- Shows total number of requests over the past 5 minutes.
- Line chart helps visualize changes in query volume.
Response Time (every 5 min)
- Reflects average response time in the last 5 minutes.
- A trend chart tracks performance over time.
📊 Click any of the status metrics to toggle the corresponding trend chart, shown at the bottom-right.
For IP trends, additional units (Day, Week, Month) are available for switching.
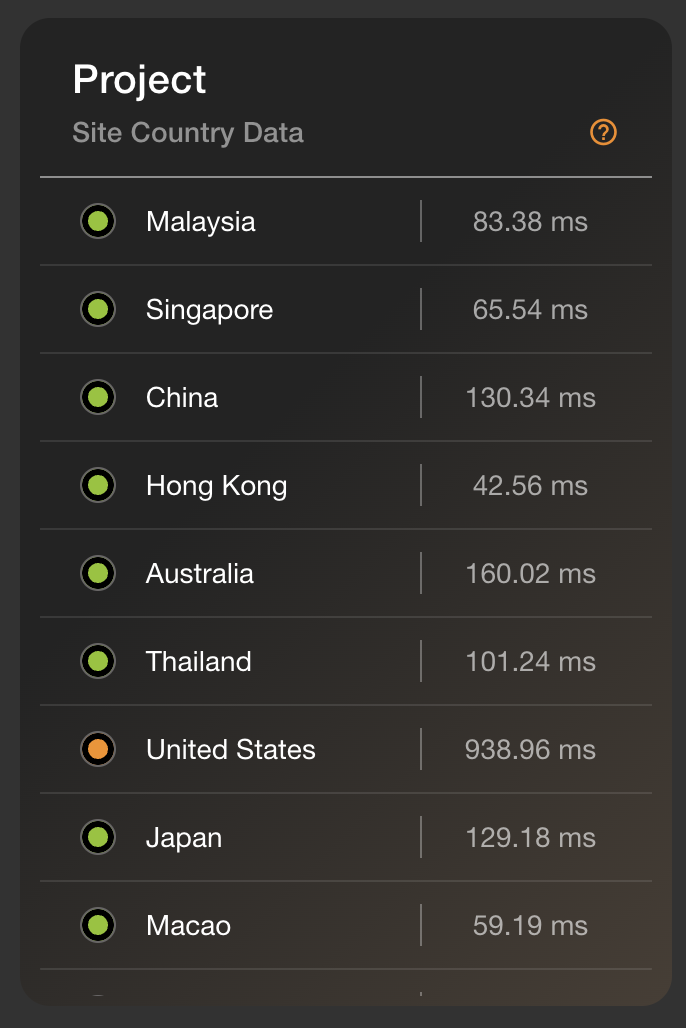
3. Country Distribution Status
Lower-left panel
- Displays a ranking of countries by user count.
- Also includes corresponding response time per country.
4. Domain Status Table
Central panel
Displays detailed status per domain, including:
- CDN Name
- Domain Name with Growth Indicator
- User Count / per 5 minutes
- API Status Distribution (green / yellow / red)
Supports column sorting to help users organize and compare metrics.
- You can click a domain to view its country distribution, or click a country to view all domains used in that region.
✅ How to Use
Search Domains
- Use the search bar to quickly locate a specific domain.
View Key Status Metrics
- Use the top-right status blocks to monitor real-time domain performance.
Analyze Country Distribution
- Use the bottom-left map to understand geographic traffic concentration.
- Click a domain to switch to its country-level view.
Inspect Detailed Metrics
- Use the central table to compare performance indicators across domains.
- Sort columns as needed for analysis.
🔄 Data Refresh Frequency
- Updates every 10 minutes