📶 Channel Info – Detailed Channel Usage Overview
📘 Overview
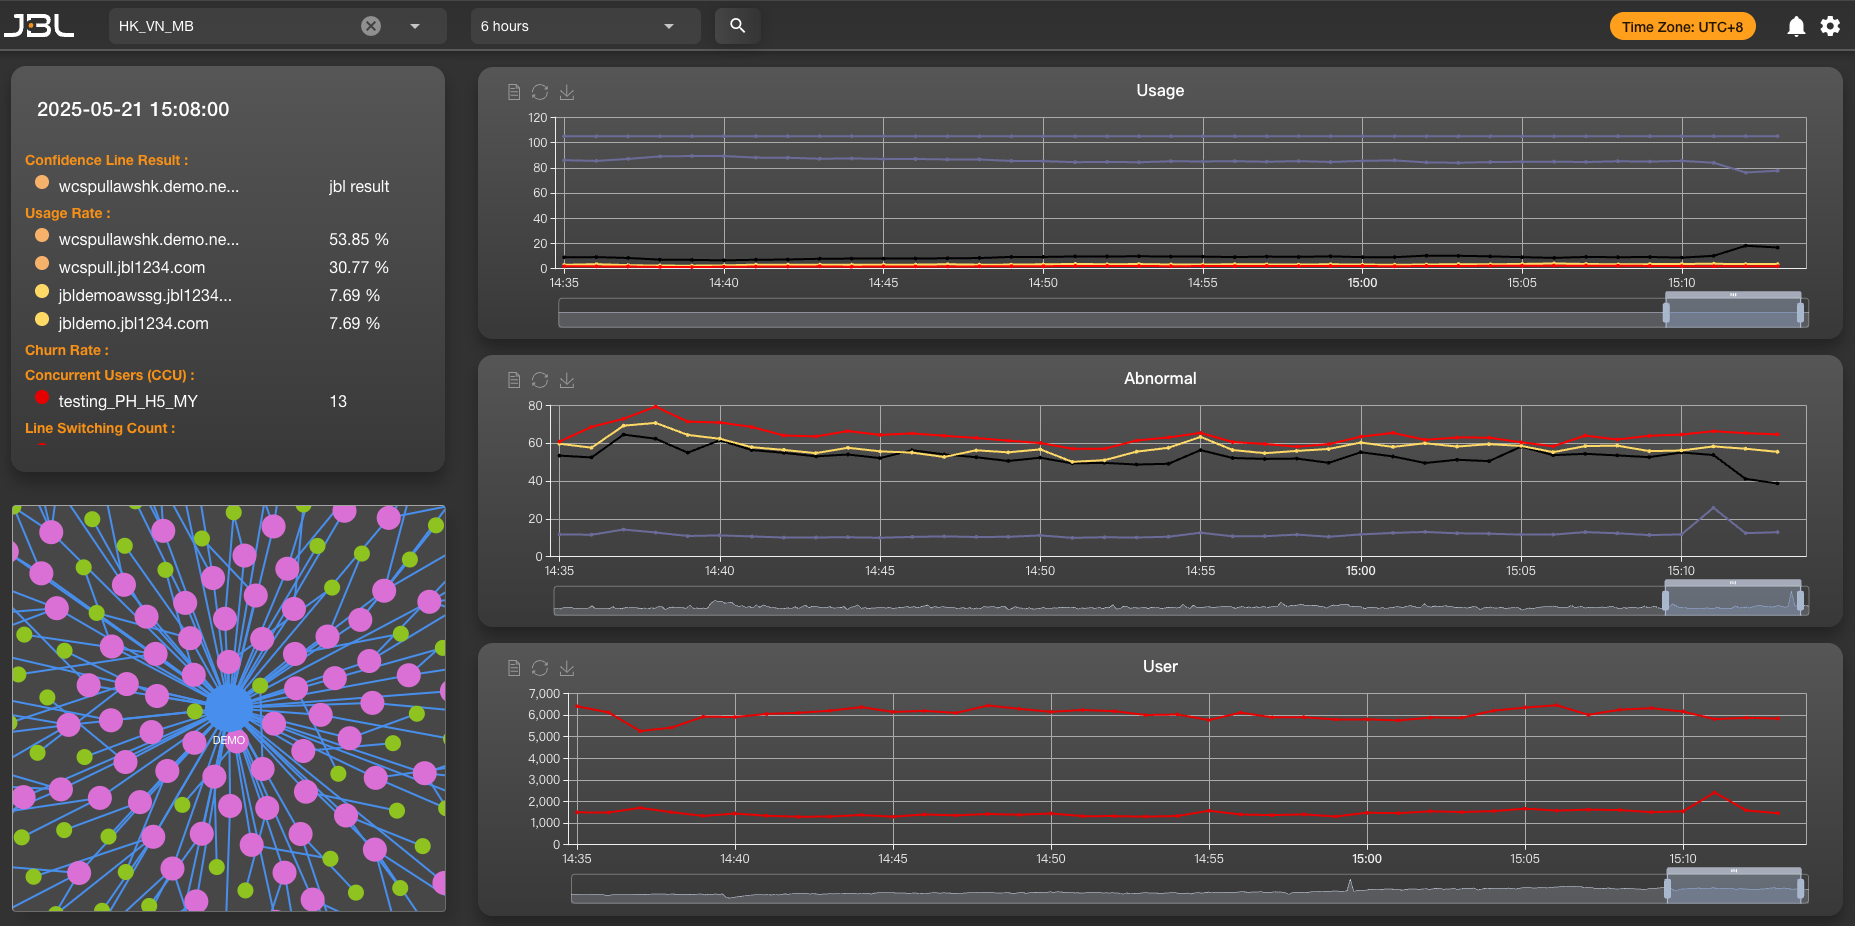
This page displays real-time usage and performance data for each CDN route within a single streaming channel.
It helps you quickly identify issues such as significant user drop-offs or frequent route switching due to unstable lines.
🧭 Feature Description
- Displays user count and usage rate for each route.
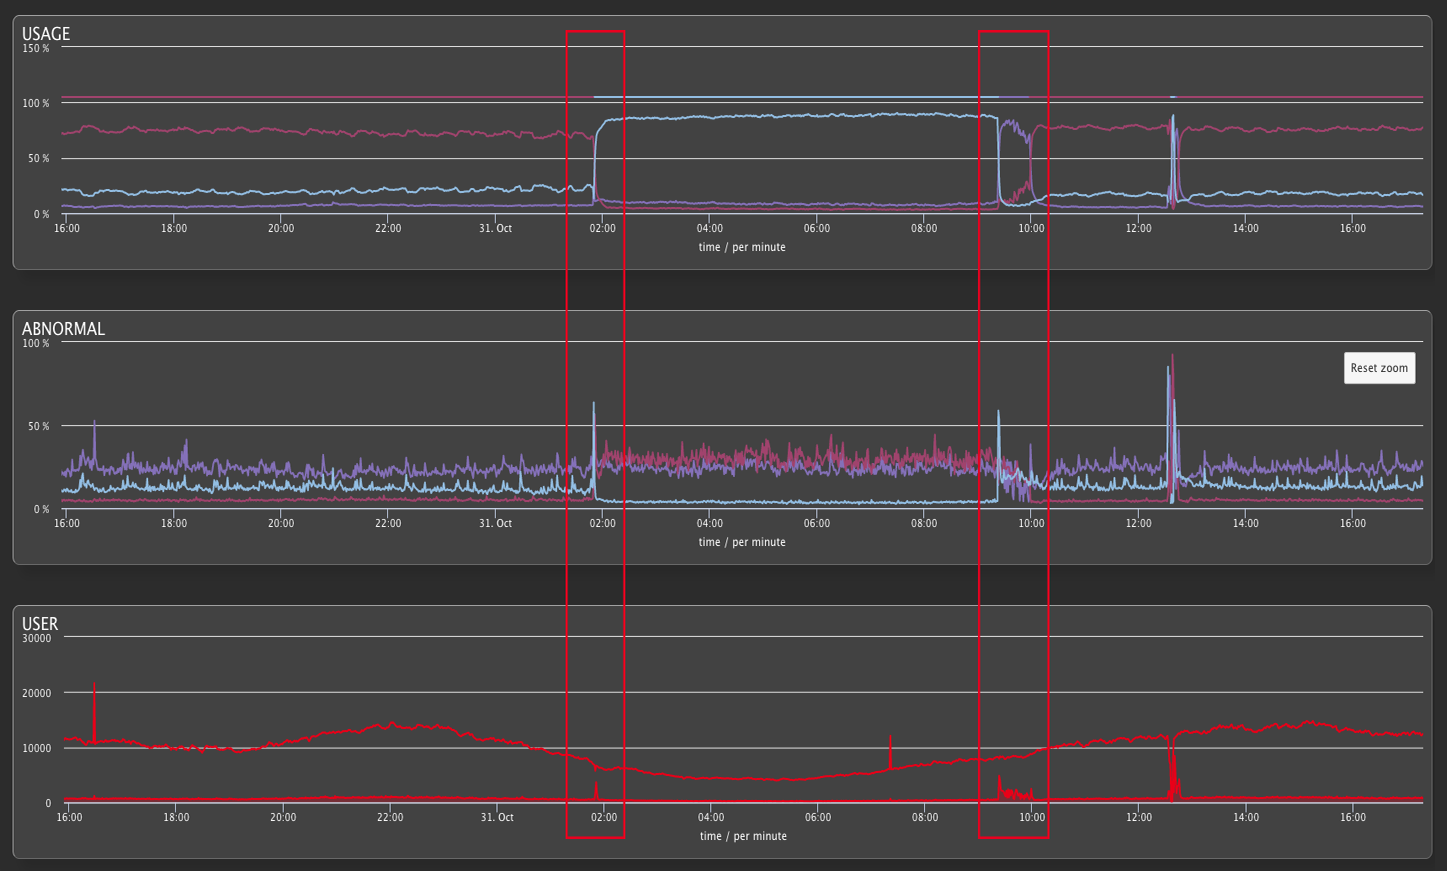
- Switch rate charts help you identify if instability on a particular route is causing user churn.
(As shown below: when red routes are unstable or degraded, JBL intelligently redirects users to more stable blue routes to prevent mass switching and sudden user drops.)
- Time range supports views from 6 hours up to 3 weeks, enabling growth analysis and trend prediction.
🧩 Left Panel – Routing Info
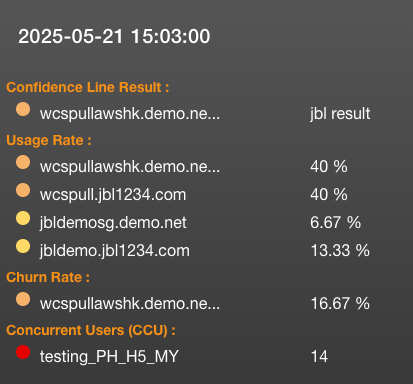
The left information panel displays key performance indicators. Below is a reference table of abbreviations:
| Abbreviation | Description |
|---|---|
| CLR | Confidence Line Result – The route selected by the smart routing algorithm |
| UR | Usage Rate – Percentage of users currently on each route |
| CR | Churn Rate – Percentage of users who left the route (i.e., due to switching) |
| CCU | Concurrent Users – Total number of users currently in the channel |
| LSC | Line Switching Count – Number of route switches within the current time window |
These indicators help you evaluate the overall health of the channel and its routes, and serve as input for optimizing route switching logic.
💡 Usage Tips
- If you observe a sharp drop in user count during a certain period, review whether excessive switching occurred at that time.
- If there are significant quality differences between routes, consider adjusting the smart routing strategy to favor more stable options.