Domain Info
📘 Overview
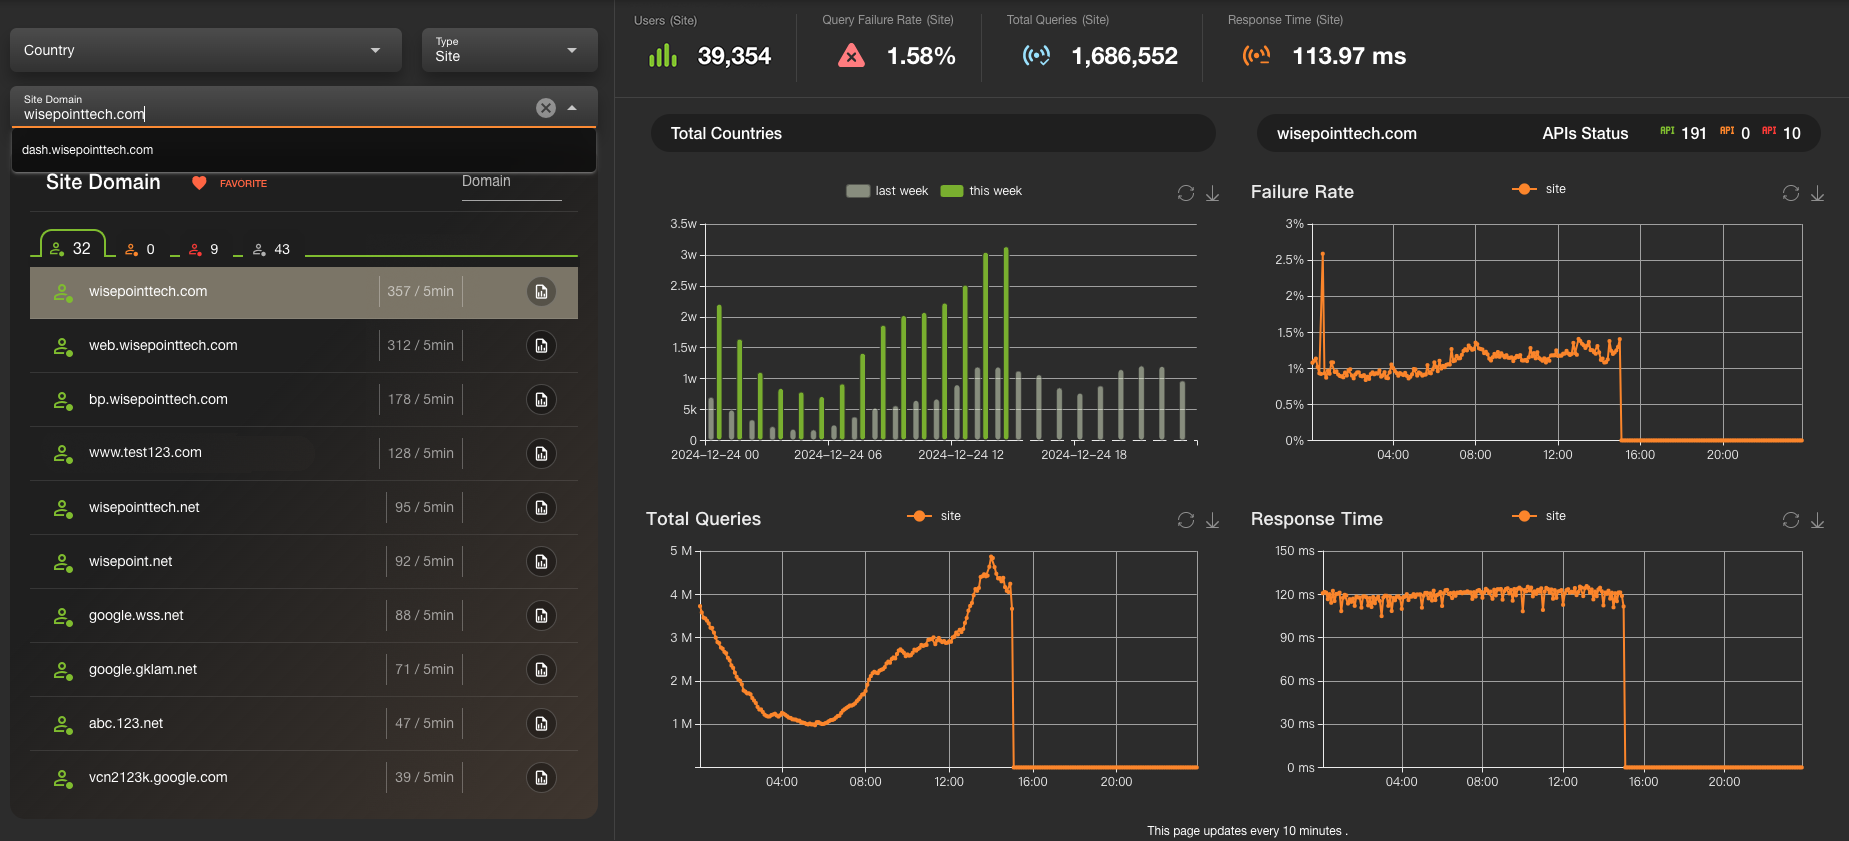
This page provides in-depth insights into each domain.
Users can analyze domain behavior, configure alert rules, and manage their favorites list for quicker access.
🧭 Main Structure & Description
1. Search & Filter
At the top of the page, users can search and filter domains using the following criteria:
- Country: Filter by country.
- Type: Filter domains by type (
Siteor3R).
Fuzzy search is supported to quickly locate target domains.
2. Domain Table (Left Panel)
Displays core information per domain, including:
- Domain Name
- Users Count
- Data update frequency (Hourly)
Each row includes two actions:
- Favorite Button: Add or remove a domain from your favorites list.
- Edit Button: Open the drawer to configure alert rules.
3. Key Stats Panel (Top-Right)
Located on the top-right, this area displays real-time statistics and trend indicators for the selected domain:
- Users (Site): Active users in the past hour.
- Query Failure Rate (Site): API error rate in the past 5 minutes.
- Total Queries (Site): Number of queries in the past 5 minutes.
- Response Time (Site): Average response time in the past 5 minutes.
4. Trend Charts
Right Panel Charts
Total Countries
- Displays user volume trends by country.
- Green represents current week data, gray represents previous week.
Failure Rate
- Trend of API failure rate for the selected domain.
Total Queries
- Line chart showing the change in total query volume over time.
Response Time
- Visualizes response time trends to assess performance.
Each chart supports:
- Refresh: Manually reload data.
- Download: Export chart data.
5. Edit Drawer
- Accessed by clicking the Edit button in the domain table.
- The drawer includes:
Alert Configuration:
- Set custom alert conditions for a domain, such as:
- Trigger alert when error rate exceeds a threshold.
- Trigger alert when response time exceeds a set limit.
- Set custom alert conditions for a domain, such as:
Save / Cancel Buttons:
- Save will apply and store the settings.
- Cancel will close the drawer and discard changes.
6. Favorites List
- Frequently accessed domains can be marked as favorites.
- Click the Favorite icon in the domain table to add/remove from the list.
- Favorited domains will appear at the top of the list for quicker access.
✅ How to Use
Filter & Search
Use the filters and search bar to find the domain you want to inspect.View Trend Charts
Analyze real-time and historical performance from the stats and trend charts.Configure Alerts
Click the Edit icon to set thresholds for failure rates and response time.Manage Favorites
Add important domains to your favorites list for quicker future access.
🔄 Data Update Frequency
- Users, Failure Rate, Total Queries, Response Time: Updated every 5 minutes.
- Chart Data: Automatically updated every 10 minutes, with manual refresh available.
⚠️ Notes
- Trend data reflects dynamic real-time behavior — it is recommended to refresh periodically to monitor changes.
- Alert configurations apply only to active domains and must be saved manually.