📘 Overview
This system provides a comprehensive global website monitoring and analysis platform.
Users can start from a world map view and drill down step by step to analyze project-level activity, domain behavior, API errors, ISP performance, and individual user traces.
📂 Category
World Map
View global usage status and latency by country using an interactive world map.Project Info
Analyze the overall distribution of users and identify the top-performing domains and countries.Domain Info
Monitor real-time domain status and anomalies, with configurable alert thresholds.API Info
Inspect static and third-party API errors per domain in detail.ISP Info
Review domain performance from the perspective of country, city, and ISP.IP Detail
Trace specific IP activities and user behavior logs for deeper investigations.Fluctuation
Visualize global traffic shifts and user growth with a real-time heatmap.
📌 Recommended workflow:
World Map → Project Info → Domain Info → API Info / ISP Info / IP Detail → Fluctuation
Start from a global overview, drill into details for performance analysis and error diagnostics.
🧭 Status Indicator Reference (Before You Start)
Before using the website analysis tools, please familiarize yourself with the meaning of the indicator colors below.
They help you quickly interpret system status and detect abnormalities.
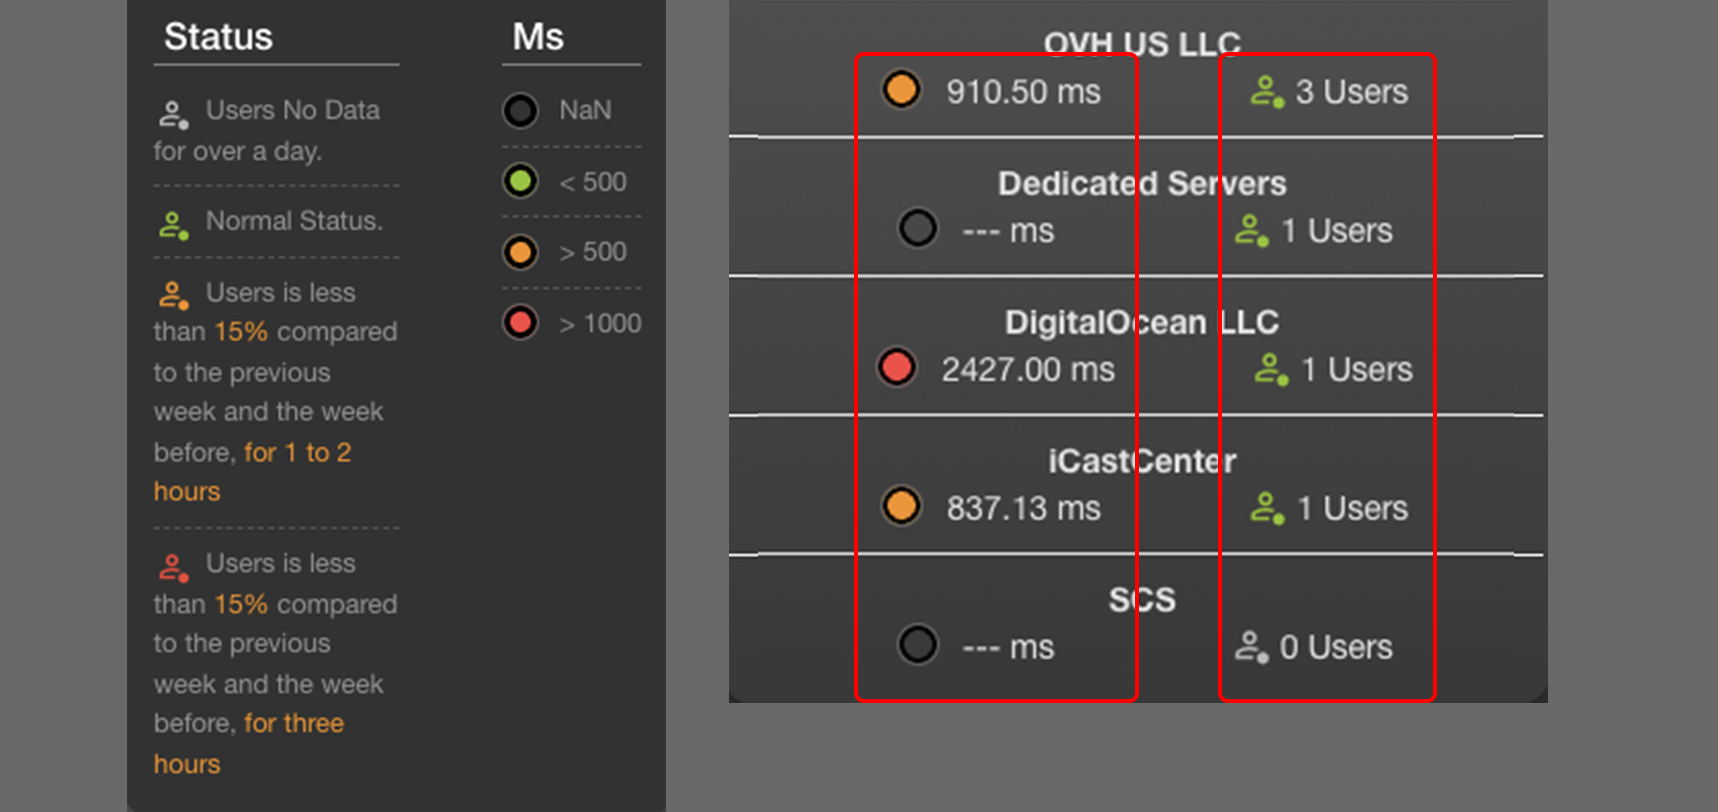
🔹 Users Indicator
JBL calculates "user count" based on unique IPs within a fixed time window (either 5 minutes or 1 hour).
- 🟤 Gray: No IP data detected; the system has not seen any user activity for over one day.
- 🟢 Green: Normal — user count is stable.
- 🟠 Orange: User count is 15% lower than the same time in the past two weeks, lasting 1–2 hours.
- 🔴 Red: User count remains 15% lower for more than 3 consecutive hours.
🔸 Response Time (ms) Indicator
- 🟤 Gray: No data (NaN)
- 🟢 Green: Response time < 500ms (Good)
- 🟠 Orange: Response time > 500ms
- 🔴 Red: Response time > 1000ms (Potential issue)