🌐 Fluctuation - Active User Growth Heatmap
📘 Overview
The Fluctuation module provides a visual overview of global user activity.
It helps users understand regional user growth and decline trends, making it easier to evaluate product performance across different locations.
🧭 Features
- Displays active users who stayed on the website for more than 5 minutes
- Drill-down structure: Country → City → Growth Trend Chart
- Block size represents total user volume; color reflects change trends (🟢 green = growth, 🔴 red = decline)
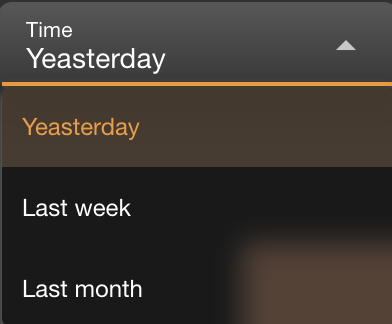
- Supports time range selection: Yesterday / Last Week / Last Month
- Each city block can be clicked to reveal daily, weekly, or monthly trend charts
📏 User Count Calculation Periods
WARNING
⚠️ Note :The user count displayed in the Fluctuation charts is based on distinct IPs who remained on the website for more than 5 minutes.
The data is aggregated only after the selected time period has ended, as follows:
| Mode | Calculation Timing |
|---|---|
| Day | After 23:59 on that day. For example, the count for May 22 is finalized at 00:00 on May 23. |
| Week | After the full 7-day week ends (typically Sunday 23:59), then the entire week’s distinct count is calculated. |
| Month | After the end of the calendar month (e.g., May 31 at 23:59), distinct IPs for the full month are calculated. |
📌 These values represent total distinct user counts per completed period, not rolling or live updates.
This ensures consistency in growth trend analysis and avoids partial data bias.
🔎 How It Works
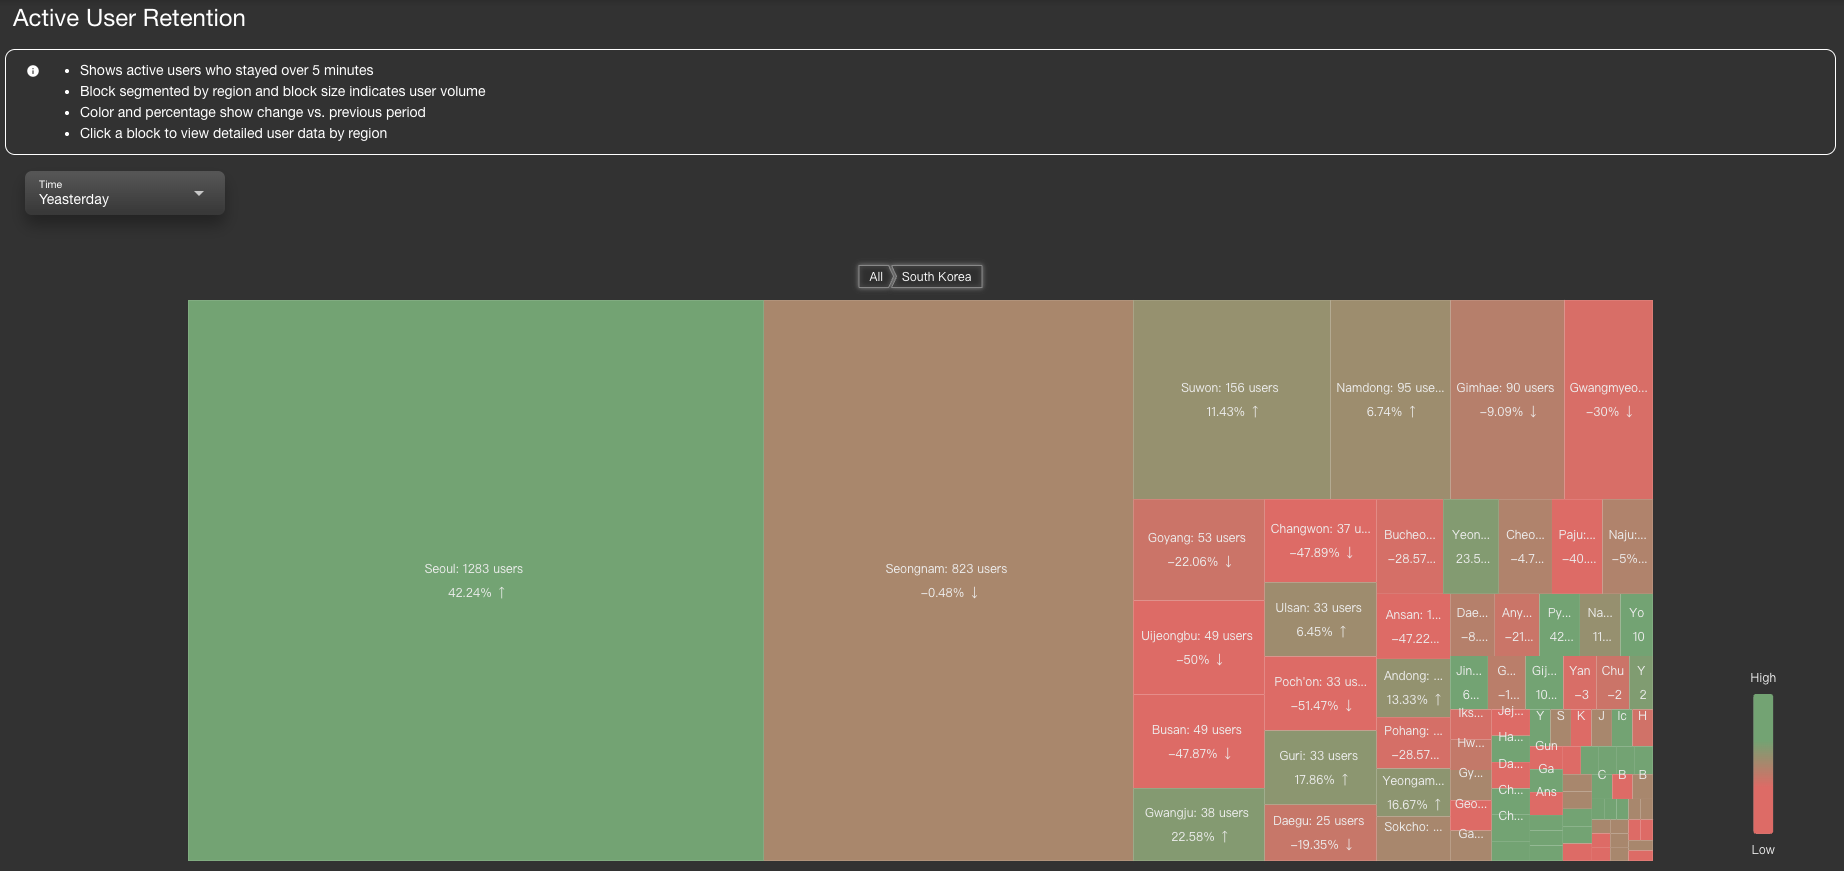
Initial Heatmap
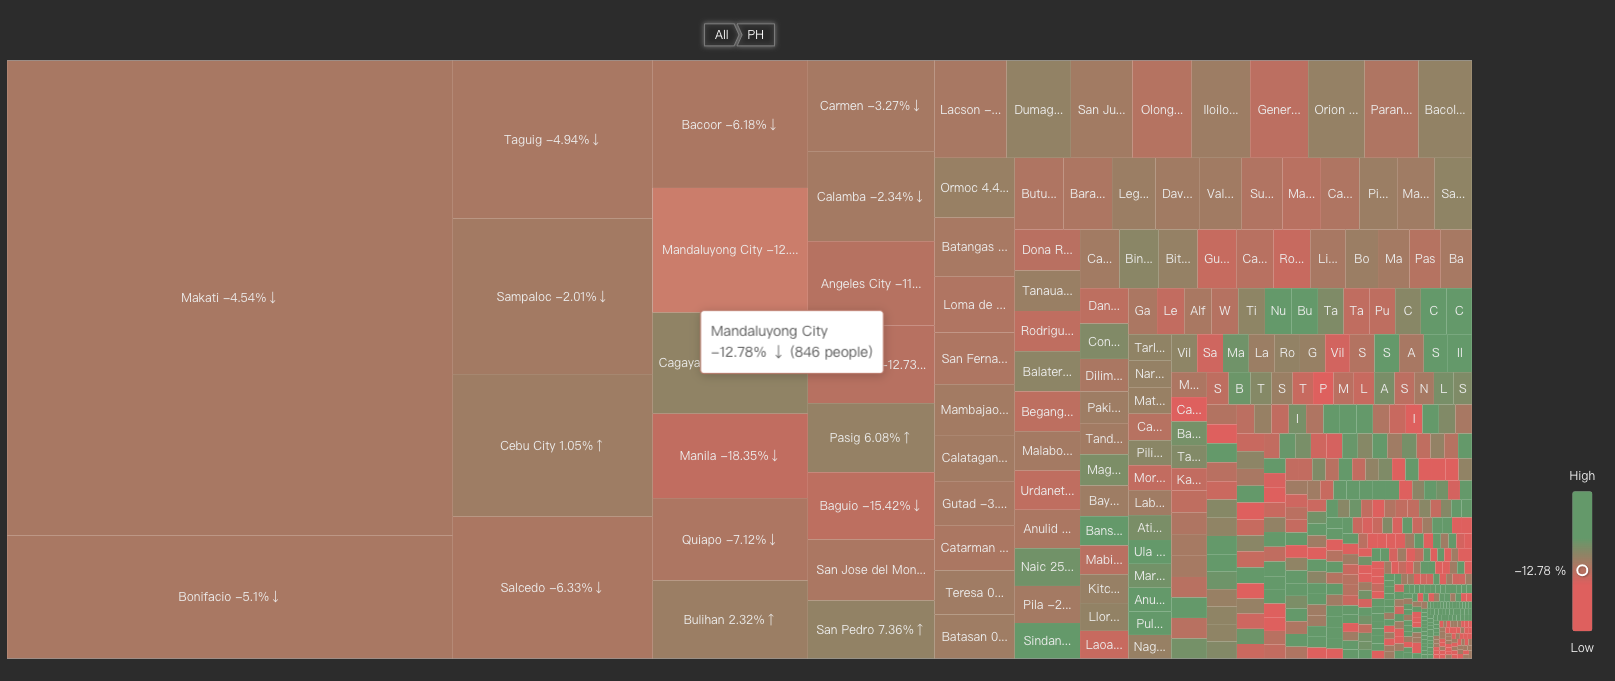
Shows the distribution of active users by country. Click on any country to drill down into its cities.City-Level View
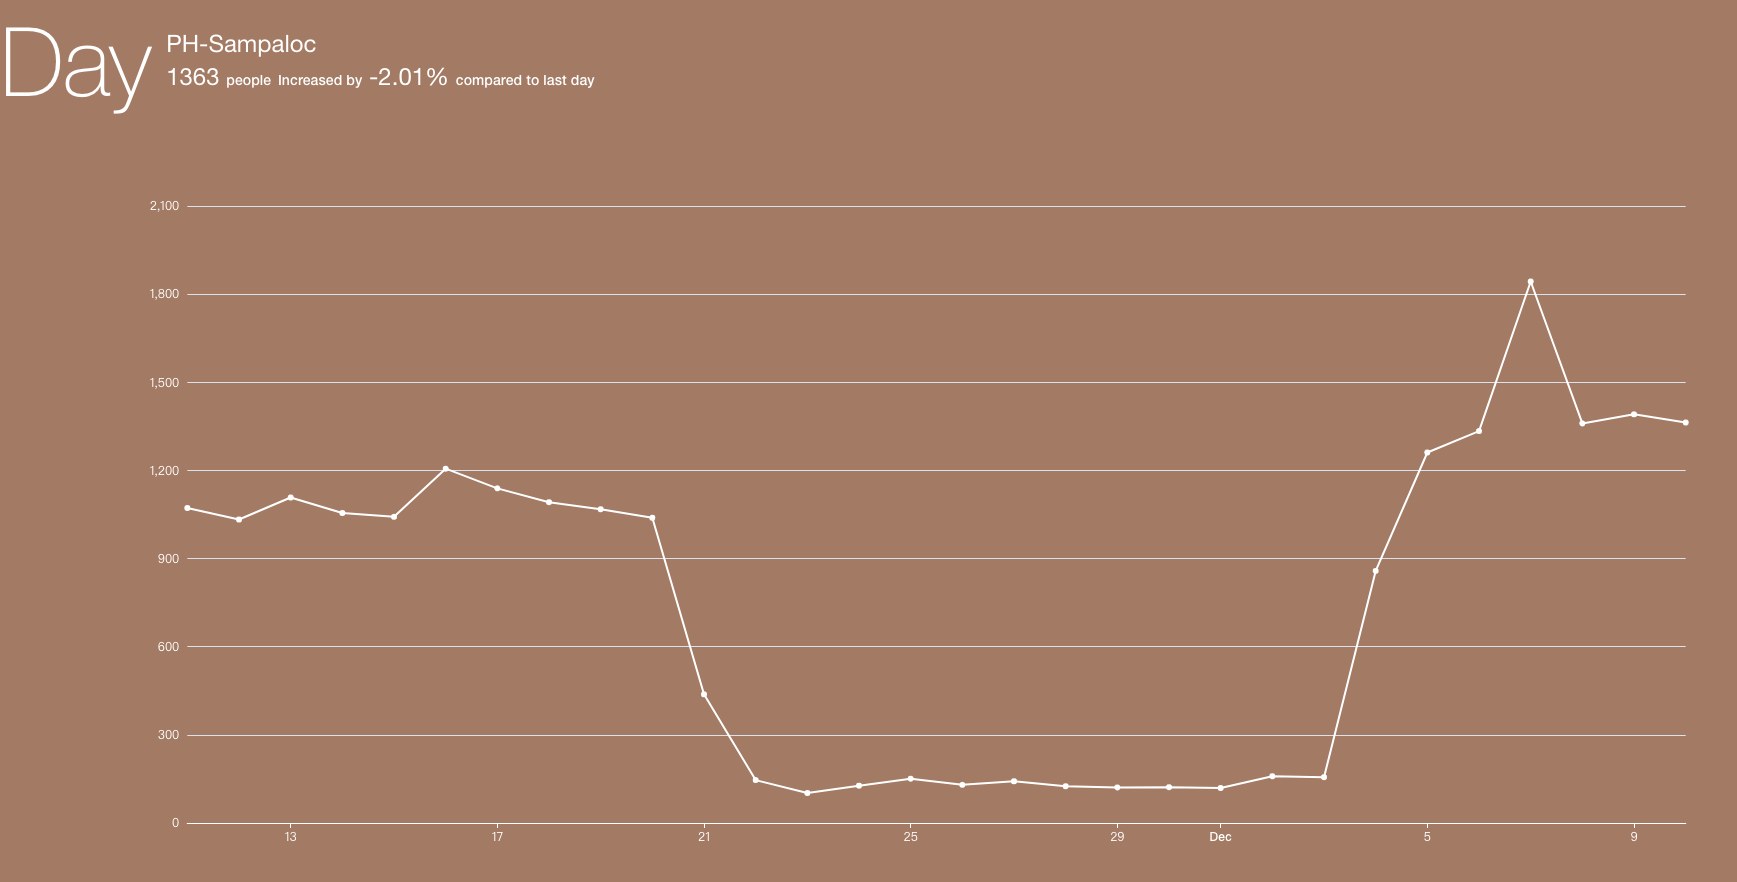
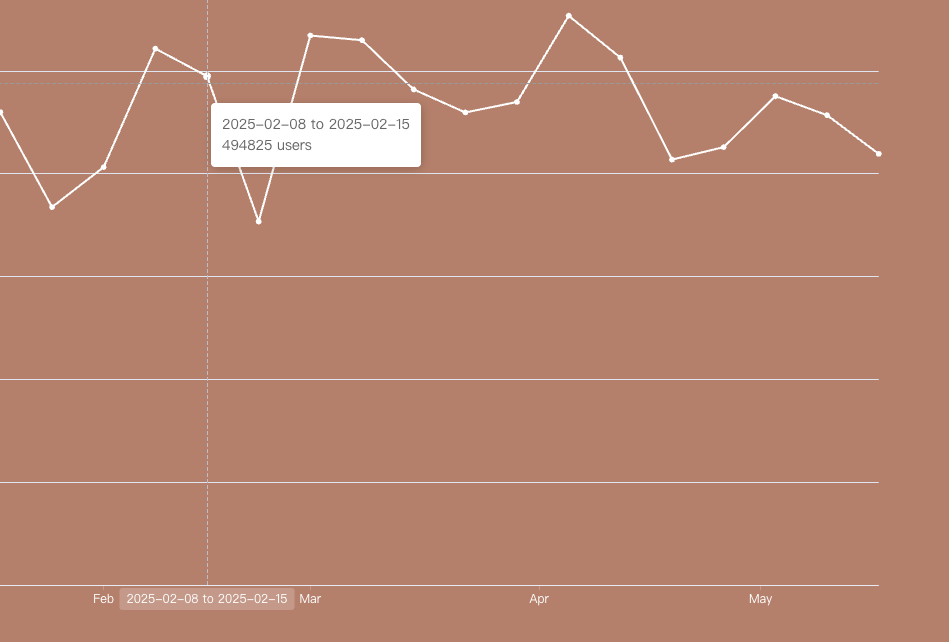
Displays all cities under the selected country, including current user count and percentage change.Trend Chart View
Clicking on a city will display its user trend chart at the bottom.Time Range Filter
Use the time selector (top-left) to switch between comparison ranges: Yesterday, Last Week, or Last Month.
🎨 Visual Indicators
- Block Size: Represents the number of users during the selected time period.
Block Color:
- 🟢 Green: User count increased compared to the previous period (e.g., yesterday vs. the day before)
- 🔴 Red: User count decreased
- Darker color = stronger change magnitude
Percentage Change: Each block displays the growth rate compared to the previous period
📌 Use Cases
- Analyze the effectiveness of marketing campaigns
- Observe traffic trends after system updates or feature launches
- If a city consistently shows a red decline, investigate local connectivity, login behavior, or content visibility
🧩 Additional Notes
- Percentage changes are calculated against the previous corresponding period:
- Yesterday → Compared to the day before
- Last Week → Compared to the week before last
- Last Month → Compared to the month before last
- Clicking on a region block will display:
- Area name
- User count
- Growth percentage with trend indicator